Back to: Multiplier Event Luxembourg
In this activity, students follow a certain engineering design process to take on the role of biomedical engineers. They will use and test a “designed” medical device that measures either their own pulse or that of others, utilising the Circuit Playground Express board’s pulse sensor. In engineering education, students should also discuss existing designs of pulse sensors.
In mathematics, students could use the Circuit Playground Express board data to determine the best way to visualise results and plot real data. In this specific case, they would focus on displaying pulse data on a computer screen. Mathematics teachers could also use these plots to introduce fundamental concepts of functions, such as identifying local and global maximum and minimum points, understanding increasing and decreasing behaviour, and exploring concavity and convexity.
The biology teacher could use this activity to explain how the human circulatory system works, including the heart (https://www.teachengineering.org/lessons/view/cub_human_lesson05), blood vessels, and blood. Students will learn about their heart rate, or pulse, and explore one of the various methods for measuring it, namely photoplethysmography. Here are some explanations related to this technique (https://www.teachengineering.org/makerchallenges/view/rice3-2349-heartbeat-microcontroller-led-senor-design-challenge):
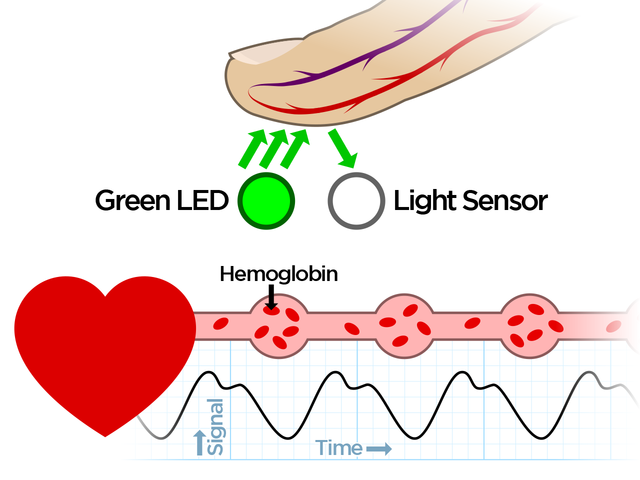
As your heart beats, it produces two distinct sounds: ‘lub’ and ‘dub’, which result from the rhythmic closing of the heart valves as blood is pumped in and out of the chambers. The ‘lub’ sound (systole) occurs when your heart contracts to pump blood through your circulatory system, while the ‘dub’ sound (diastole) happens when your heart relaxes and refills with blood. During systole, your skin has slightly more blood than during diastole. When you shine green light onto your fingertip, the blood affects the light. Since the amount of blood changes with each heartbeat, these changes can be detected by measuring the light that reflects from the skin of your fingertip. Green light is used because the red colour of the blood cells absorbs it. The redder the blood, the more green light is absorbed. This phenomenon can be studied in optics in collaboration with the physics teacher. In this context, referring to the section A colour’s RGB is also interesting.
The readings can change with your breathing or if your finger moves during measurement. Keep your finger still to ensure accuracy and avoid unintended light variations.